

Measure first-response and resolution timing

Reports over 7/30/90-day windows covering first human response, coverage, percentile timing, resolution timing, and first-responder and daily breakdowns.

  • 7-, 30- and 90-day windows
  • First human response, coverage including unanswered, and percentile timing
  • Resolution timing for eligible resolved conversations

No credit card required

A response-time report dashboard with clearly labelled example rows and percentile bars
  • Grounding controls, not guesswork
  • 11 flow step types, no code
  • Shared inbox with handoff
  • Start on the free plan

What gets measured

Adding chat to a website creates a promise: someone is here. Response-time reporting is how you check whether you are keeping it. onmsg reports over 7-, 30- and 90-day windows, and each window covers the same set of figures, first human response times, response coverage including unanswered conversations, average, median and 90th-percentile timing, resolution timing for eligible resolved conversations, and first-responder breakdowns with daily rows.

The definitions matter more than the charts. A first human response is a reply from a person. Bot messages do not count, and neither do private notes, so the number tells you when a human actually engaged rather than when the widget said something.
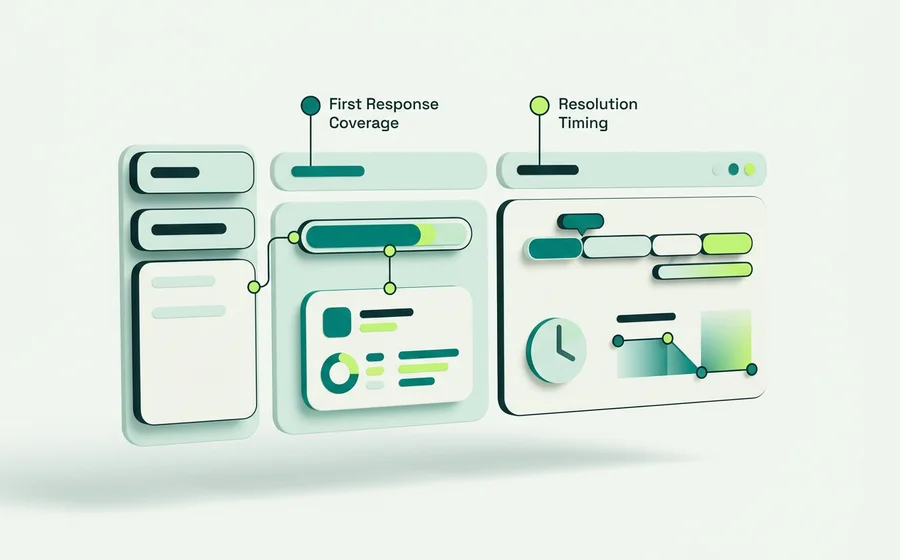
A report row annotated to show first-response, coverage and resolution timing columns

Common problems this solves

“Our average response time looks great and customers still complain.” Coverage and the 90th percentile usually explain it. A handful of instant replies pulls the average down while a slow tail, or a set of conversations nobody answered at all, does the damage.

“We don’t know if anything got missed.” Response coverage counts the unanswered conversations rather than quietly dropping them from the denominator.

“We can’t tell whether Tuesdays are the problem.” Daily rows show the shape of the window, and first-responder breakdowns show who is carrying it.

“We closed the ticket but the customer waited three days.” First response and resolution timing are separate figures for a reason. A fast acknowledgement and a slow resolution are two different problems.

Reading the numbers honestly

Three boundaries are worth holding in mind. The reports use elapsed time in UTC, not business hours, an enquiry that arrives at 10pm and is answered at 9am reads as eleven hours, not as a same-morning reply. They are not contractual SLA reporting, and nothing here should be presented to a customer as one. And they draw on retained history, so your plan’s retention setting decides how far back a window can genuinely reach.

None of that makes the numbers less useful. It makes them comparable week to week, which is the property you actually need when you are trying to work out whether last month was better.

Where this fits

Reporting only means something once conversations are flowing through the Shared Team Inbox, since that is where a human response happens. If your first-response numbers are worse than you expected, the usual fixes are upstream: better after-hours handling in the chat widget, or a grounded AI agent answering more of the repeat questions so the queue is shorter when a person opens it.

When you need this, and when you don’t

Reporting is most useful once two things are true: enough conversations are reaching people that a pattern exists, and more than one person is answering. Below that, you already know what happened. You were there.

The moments it earns its place:

After adding chat to a busy site. Volume changes behaviour, and the first month is when coverage problems appear.

When you add a second or third person to the inbox. The first-responder breakdown shows how the load is actually distributed, which is rarely how anyone assumed.

Before and after a change. Added an offline path, moved twenty answers into the knowledge base, changed who covers mornings, the 30-day window either moved or it did not.

When someone says replies are slow. An impression is hard to argue with. Coverage and the 90th percentile are not.

Reading it without punishing anyone

One caution worth stating. Because timing is elapsed UTC on retained history, the numbers include your nights, weekends and holidays. A team that answers every enquiry promptly during working hours will still show long response times if enquiries arrive at 2am.

Used as a management metric without that context, the report will make a good team look bad and push people toward answering fast rather than answering well. Used as an operational instrument (where are conversations being missed, which window is uncovered, is the tail getting worse) it is genuinely useful. The difference is entirely in how it is read.

For the detail, read what the response-time reports measure and reading first-response, coverage and resolution timing.


Product tour

Reporting in the product

Clearly labelled example views of the screens involved.

A seven-day report window selector beside thirty and ninety-day options
Three windows: 7, 30 and 90 days.
Average, median and 90th-percentile response time figures displayed side by side
Average, median and 90th-percentile timing together.
A coverage chart including a clearly marked unanswered conversations segment
Coverage counts the unanswered conversations too.
A first-responder breakdown table with daily rows beneath it
First-responder breakdowns and daily rows.
Why onmsg

Why teams use onmsg for reporting

Reports over 7/30/90-day windows covering first human response, coverage, percentile timing, resolution timing, and first-responder and daily breakdowns.

Coverage, not just speed

Response coverage includes the conversations nobody answered. An average that quietly excludes the ones you missed is the most flattering and least useful number in support reporting.

The 90th percentile is in the room

Average, median and 90th-percentile timing sit side by side, so the slow tail is visible rather than averaged away by a run of quick replies.

Only human replies count

Bot messages and private notes do not count as a first human response. The number reflects when a person actually answered.

Resolution timing where it applies

Eligible resolved conversations get resolution timing, so you can see how long things took to close rather than only how fast the first reply went out.

Per-person and per-day detail

First-responder breakdowns show who is picking things up, and daily rows show where a bad week actually went wrong.

Clear about what it is not

The reports use retained history and elapsed time in UTC. They are not business-hours calculations and not contractual SLA reporting, and we say so on the report rather than in the small print.

How these reports differ from a typical response-time average

CapabilityTypical website chat toolonmsg
Unanswered conversationsExcluded, so the average only counts replies that happenedIncluded in response coverage, so misses stay visible
What counts as a first responseAny message on the conversation, bot replies includedFirst human response only; bot messages and private notes do not count
The slow tailAveraged away by a run of quick repliesAverage, median and 90th-percentile timing shown side by side
Closing the loopFirst reply onlyResolution timing for eligible resolved conversations
Attribution and trendOne headline numberFirst-responder breakdowns and daily rows across 7, 30 and 90 days
What the clock measuresOften unstated, sometimes implied to be business hoursElapsed UTC time on retained history, stated on the report, not SLA reporting
Questions

Reporting FAQs

What windows do the reports cover?

Seven, thirty and ninety days. Each window covers first human response times, response coverage including unanswered conversations, average, median and 90th-percentile timing, resolution timing for eligible resolved conversations, and first-responder breakdowns with daily rows.

Do bot replies count as a first response?

No. Bot messages and private notes are excluded. Only a human reply counts as a first human response, which is the point of the metric.

Is this SLA reporting?

No. The reports use elapsed time in UTC on retained history. They are not business-hours calculations and they are not contractual SLA reporting, so a 14-hour figure on an overnight conversation reflects the clock rather than a broken promise.

What is response coverage?

The share of conversations that received a human response, counted against all conversations in the window including the unanswered ones. It is the number that stops a fast average from hiding a queue nobody worked.

Why look at the 90th percentile?

Because the average hides your worst days. The 90th percentile tells you what the slowest tenth of your visitors experienced, which is closer to how a reputation is actually formed.

What counts as an eligible resolved conversation?

Resolution timing is reported for resolved conversations that qualify within the window being measured. Conversations still open, or resolved outside the window, are not included in that figure.

How far back can I report?

Reports draw on retained history, so the practical limit is your plan's retention setting. If retention is 30 days, a 90-day window can only reflect what is still retained.

Can I see who answered first?

Yes. First-responder breakdowns attribute the first human response, and daily rows show the pattern across the window.

No credit card required

Ready to set up reporting?

Reports over 7/30/90-day windows covering first human response, coverage, percentile timing, resolution timing, and first-responder and daily breakdowns. Start on the free plan and configure it on your own site.

  • Free plan available
  • Installs with a script snippet
  • Your content, your controls
Start free